
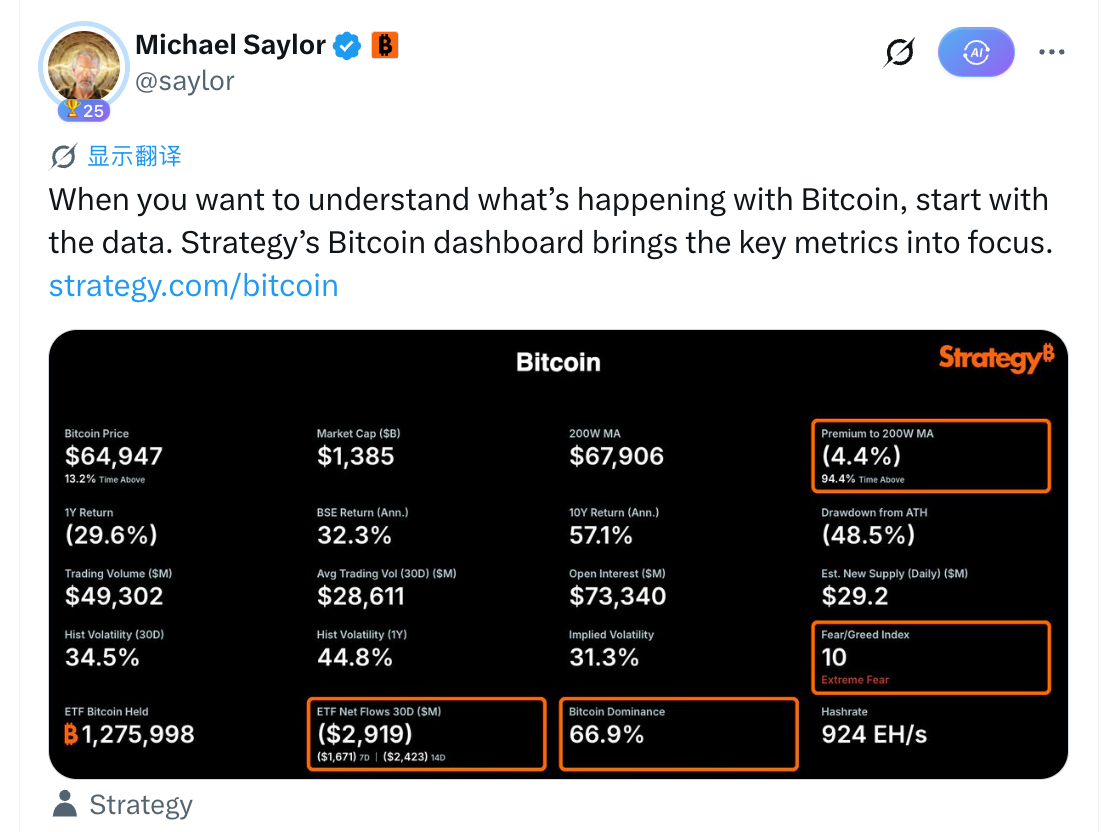
On November 16, 2026, Michael Saylor shared a screenshot of Strategy’s Bitcoin dashboard on X, highlighting four measures of market conditions: the 200-week moving average, spot Bitcoin ETF flows, sentiment and Bitcoin’s share of total crypto market value. As reported that day, the dashboard showed Bitcoin below its 200-week average alongside substantial ETF outflows and an “extreme fear” reading. Those readings describe conditions at the time, not whether a price bottom had formed.
Price and fund flows
Strategy’s dashboard put Bitcoin at $64,947, against a 200-week moving average of $67,906—a gap of −4.4%. It also showed that Bitcoin had traded above that average for 94.4% of its historical trading time. That makes the reading unusual by this measure, but historical rarity alone does not establish what happens next.
The dashboard reported $2.919 billion in cumulative net outflows from spot Bitcoin ETFs over the preceding 30 days, including $2.423 billion over 14 days and $1.671 billion over seven days. Its Fear and Greed Index stood at 10, labeled “extreme fear.” Bitcoin futures open interest was $73.34 billion; that figure does not, by itself, show which direction traders expected the market to take.
Bitcoin’s share of the crypto market
Bitcoin dominance stood at 66.9%, while its price was 48.5% below its all-time high and its one-year return was −29.6%, according to the dashboard. TechFlow interpreted the rising dominance during a broader crypto downturn as a sign that other crypto assets faced greater pressure. The dominance figure shows Bitcoin’s relative share, however; it does not on its own establish that capital moved from those assets into Bitcoin.
Taken together, the November 16 readings showed a price below a long-term average, recent spot Bitcoin ETF outflows and weak sentiment. They did not determine how long those conditions would persist or confirm that Bitcoin had reached a bottom.