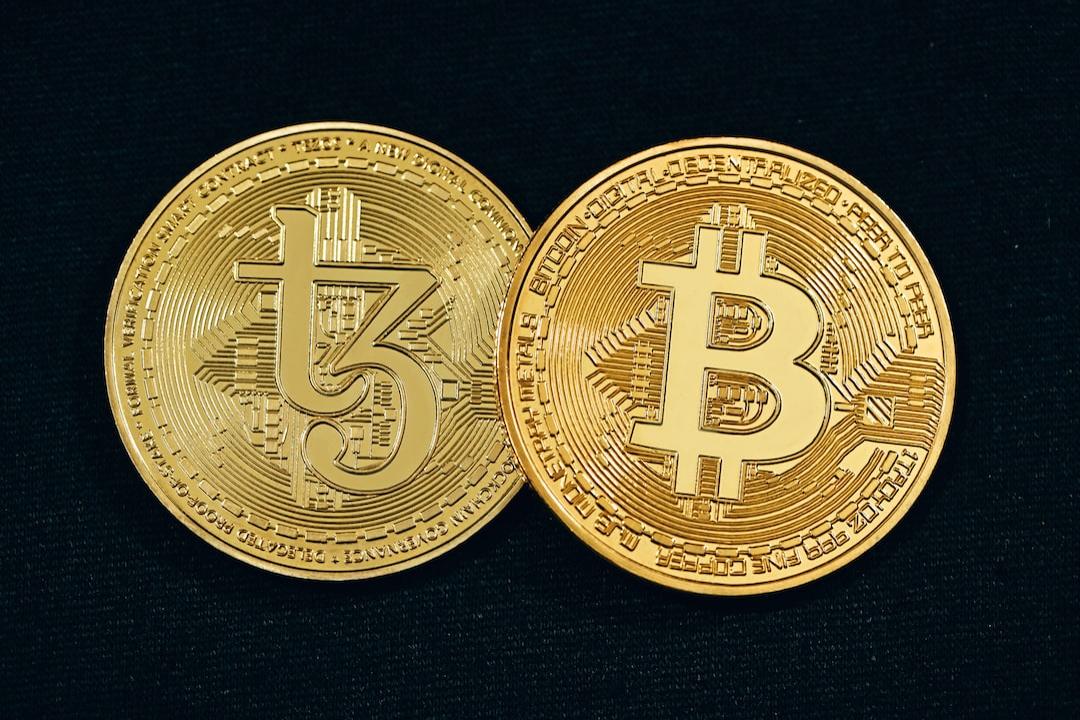
Beijing News Report:
We’re entering another active week.
The first step towards a resurgence in Bitcoin trading volume has been taken, although some aspects remain to be proven, we can initially characterize this move as positive.
In June, Bitcoin revisited the lower boundary of its three-month fluctuating channel since March.
This channel’s lower limit covers the $60,000 level. Another significant level within this channel is at $67,000.
The upper limit of this channel ranges between $71,000 and $71,000. A breakthrough in Bitcoin price beyond $67,000 could bring relief to cryptocurrency investors.
The significance of these levels should be widely recognized.

When reviewing the weekly timeframe again, the importance of the blue region is evident.
For several months, Bitcoin has been trapped between the white diagonal and the blue primary support zones.
Last week, there was again a shadow below the blue region, but we saw recovery at the week’s close.
Considering BTC’s position last week, we can say the candle’s closing was fairly decent.
Horizontal movements above the blue region continue.
Currently positioned in Bitcoin, we face selling pressure from miners and the German government, offering hope for the future.
July, potential mountain. We will evaluate the impact of Gox sellers on prices.

There is still no definitive information on when ETH ETF spot trading will begin.
Certainly, this uncertainty does not change the fact that ETF trading is likely to commence in July.
Ether continues to undergo this process with a strong stance.
Ether has undoubtedly become one of the strongest cryptocurrencies in recent years. It continues to move within the long-trapped Zone 6.
In Ether, the $3,200 to $3,300 region provides strong support, with buyers taking action despite some hesitation.
The fact that ETH occupies at least the sixth zone area before ETF trading starts can be seen as a positive development for the future.
When it breaks above this area (Zone 6) ($4,000), the only resistance ahead will be the red zone.
This naturally opens the door to new summits.
After a while, we can see the red zone turning into a support area.

Recently, for various reasons, the Solana network continues to be favored.
For SOL investors, the truly exciting development is VanEck’s application for a SOL ETF.
SOL successfully broke through the maroon main resistance zone and consolidated below this zone from November 2022 to October 2023.
Subsequently, it quickly reached the green main resistance zone (then resistance).
SOL was rejected at this resistance zone but tested it again two months later and successfully passed through.
Currently, it is trapped between the green support zone and the blue resistance zone.
Although the green support level was tested again this week, the arrival of the ETF application is temporarily meaningful as SOL strengthens its position.
SOL needs to overcome this tumultuous process in the green zone of the cryptocurrency market. This path marks a good first step, but victory is not yet complete.

The total market capitalization has recently performed well.
The green zone has now become the main support area.
A total market cap above this area indicates a very robust cryptocurrency market.
A price trend below the green zone indicates market weakness.
Despite unfavorable weather in recent months, the total market cap remains above the green zone.
Shortly before trading begins, the spot ETH ETF remains above the green zone.
Of course, not all products can expect severe attacks in a short period.
Certainly, maintaining positions in major support areas like Bitcoin, Ether, and SOL will stabilize the total market cap.
The current outlook for total market capitalization is very optimistic amidst this chaotic period.


