CoinWorld reported:
Original source: Crypto Ayaw

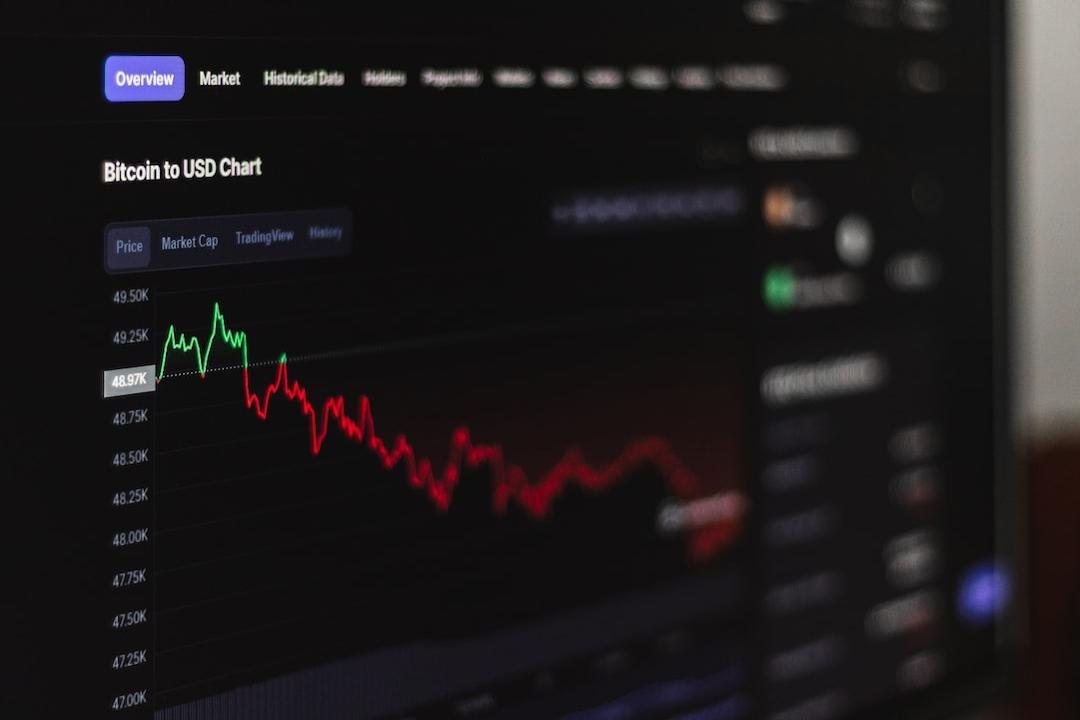
With Bitcoin experiencing its seventh consecutive bullish day, will its upward momentum extend to $69,848 this weekend?
As the bullish recovery unfolds, Bitcoin’s trend momentum has strengthened. Following a 7.77% increase in the previous week, it rose another 7.5% last week.
With the recovery gaining traction, the BTC price has increased by 7.88% since September 1, opening at $58,967. Furthermore, the strong momentum rebound in BTC price may mitigate the 8.74% decline expected on August 8, 2024.
However, the short-term bull market for Bitcoin continues to adhere to the consolidation range established since March 2024. With declining prices across several monthly candlesticks, the BTC price trajectory indicates that a rebound could break through the historical high of $73,794.
Bitcoin Halving Pattern Reemerges
Prominent cryptocurrency analyst Ali Martinez emphasized the similarity of Bitcoin’s price trend following halving events in a recent tweet. After the second Bitcoin halving in 2016, the price surged by 61% in the fourth quarter.
Meanwhile, during the third BTC halving in 2020, Bitcoin’s price skyrocketed by 171% in the last quarter of that year. In 2024, BTC is exhibiting a similar price trend consistent with halving patterns.
Based on this hypothesis, BTC prices are likely to surge in the coming three months of 2024. Additionally, Coinglass data shows that BTC prices have recorded significant increases in October over the past five years.
Data indicates a 28.52% increase in 2023, a 39.93% rise in 2021, and a 27.7% increase in 2020. In October 2016, following the halving, BTC prices rose by 14.71%. Therefore, BTC prices are expected to continue their bullish trend.
Bitcoin V-Shaped Recovery Targeting $69,000
On the 4-hour chart, the short-term Bitcoin price trend exhibits a V-shaped recovery, challenging the neckline at $64,600. With a potential breakout, BTC is likely to challenge the resistance level of $69,848 by the end of this week.

The intermediate resistance at $66,560 may require a retest of the breakout at $64,600. Conversely, key support levels for Bitcoin are at $61,451 and $57,681.
Finally, technical indicators enhance the likelihood of Bitcoin’s upward movement. The MACD indicator shows that the MACD and signal line are approaching a positive crossover.
Simultaneously, the 200 and 100 SMA on the 4-hour chart are trending bullish, with a potential positive crossover. Thus, the bullish impact on Bitcoin’s short-term dynamics is strengthening.
Subscribe to Updates
Get the latest creative news from FooBar about art, design and business.
Bitcoin BTC Expected to Surpass 69000 with Enhanced Bullish Momentum in Semiannual Mode
Add A Comment

