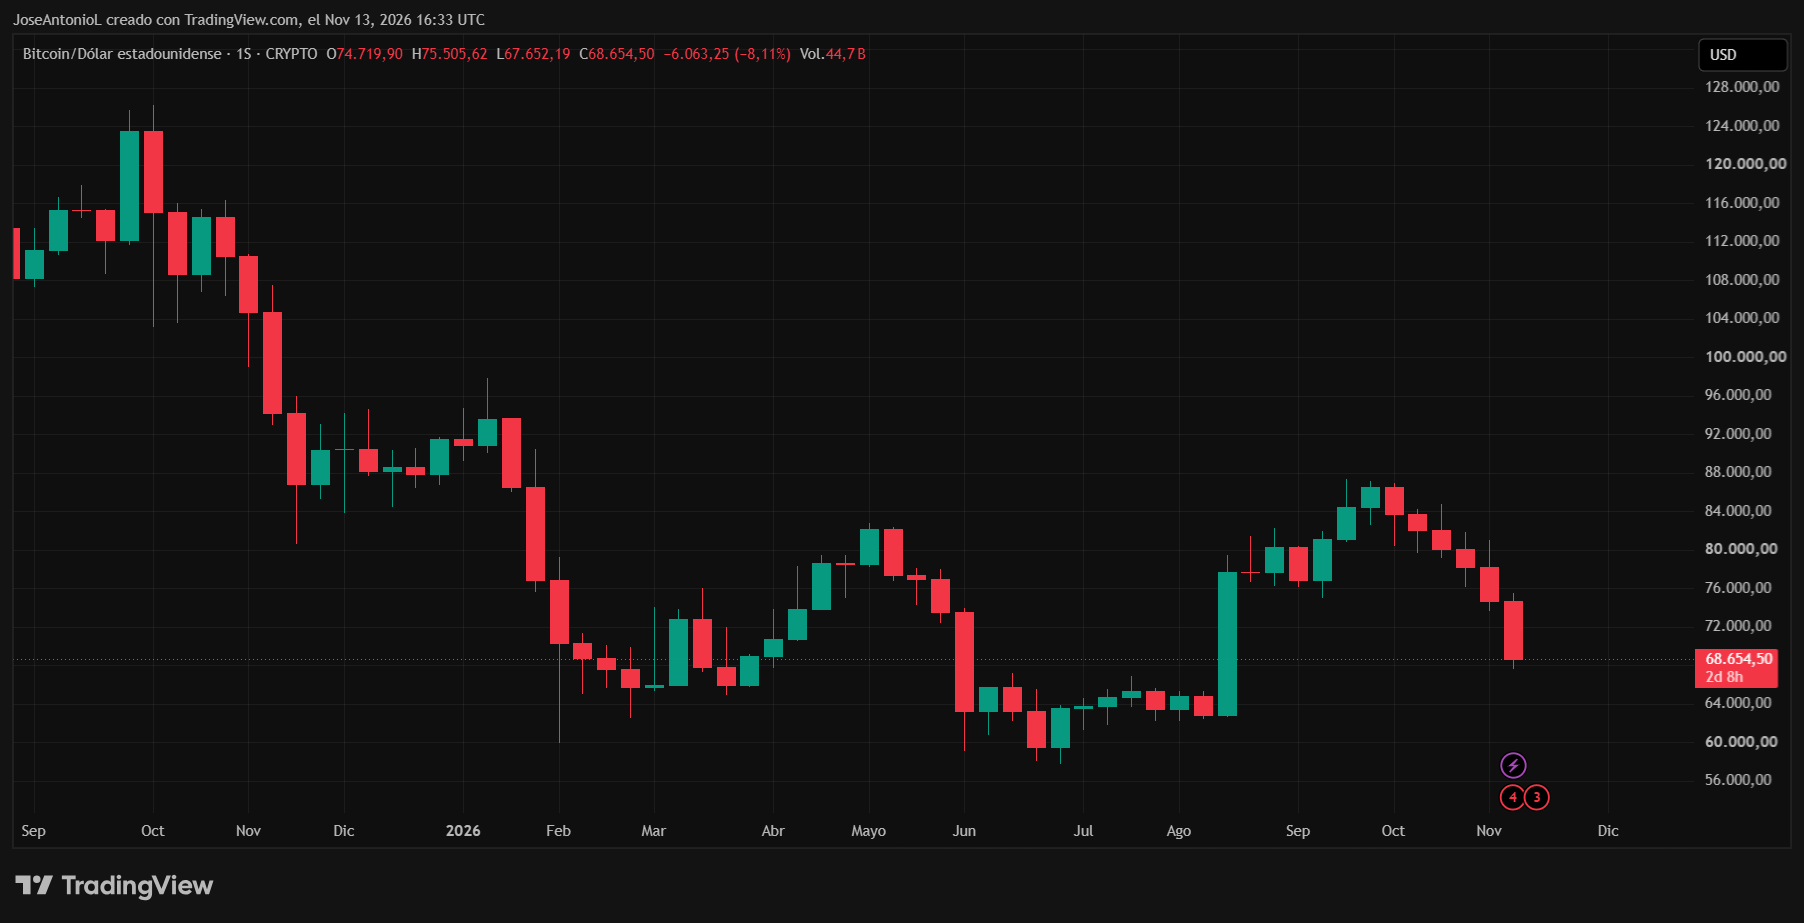
Bitcoin fell to roughly $68,500 on Friday, November 13, 2026, its lowest level in 12 weeks. Friday market data put BTC down about 4.5% over 24 hours and 9.5% for the week. The decline had erased most, but not all, of its late-summer recovery: Bitcoin remained approximately 16% above its late-June low near $59,000, while trading roughly 21% below its autumn peak around $86,000.
Inflation and the December rate decision
Chicago Federal Reserve President Austan Goolsbee warned Friday that inflation pressures had spread beyond energy and tariffs to services, medical costs and demand from AI data centers. He did not explicitly endorse a December rate increase. Fed Governor Christopher Waller, however, said Tuesday that he supported an increase of at least 25 basis points at the December 8–9 meeting. He said a stronger move might be needed if October core CPI rose by around 0.3% or more. The subsequent reading was 0.3%, above the 0.2% forecast.
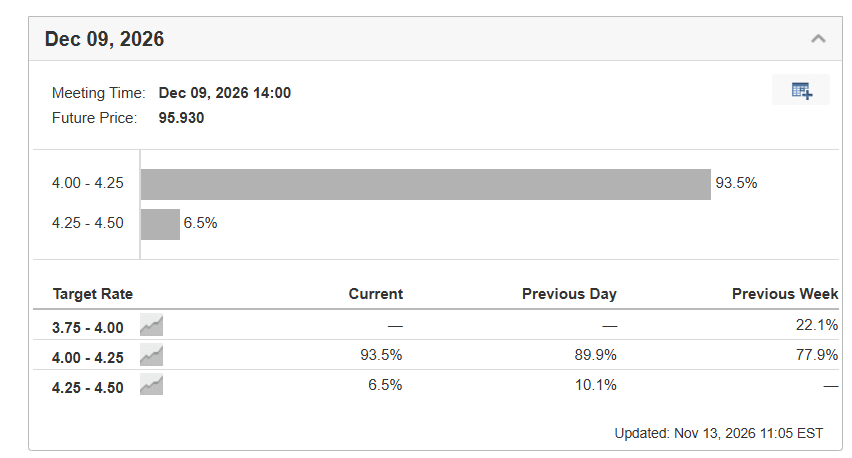
As of November 13, futures-based probabilities assigned a 91.9% chance to a quarter-point increase and an 8.1% chance to a half-point increase. Those were trader expectations, not a Fed decision. The Fed’s target range was 3.75%–4.00%. Friday’s producer-price report showed October wholesale prices rising 0.3%, less than forecast, but up 6.5% year over year—the largest annual increase since 2022. Higher rates can make interest-bearing investments relatively more attractive than speculative assets such as Bitcoin.
ETF flows and price levels
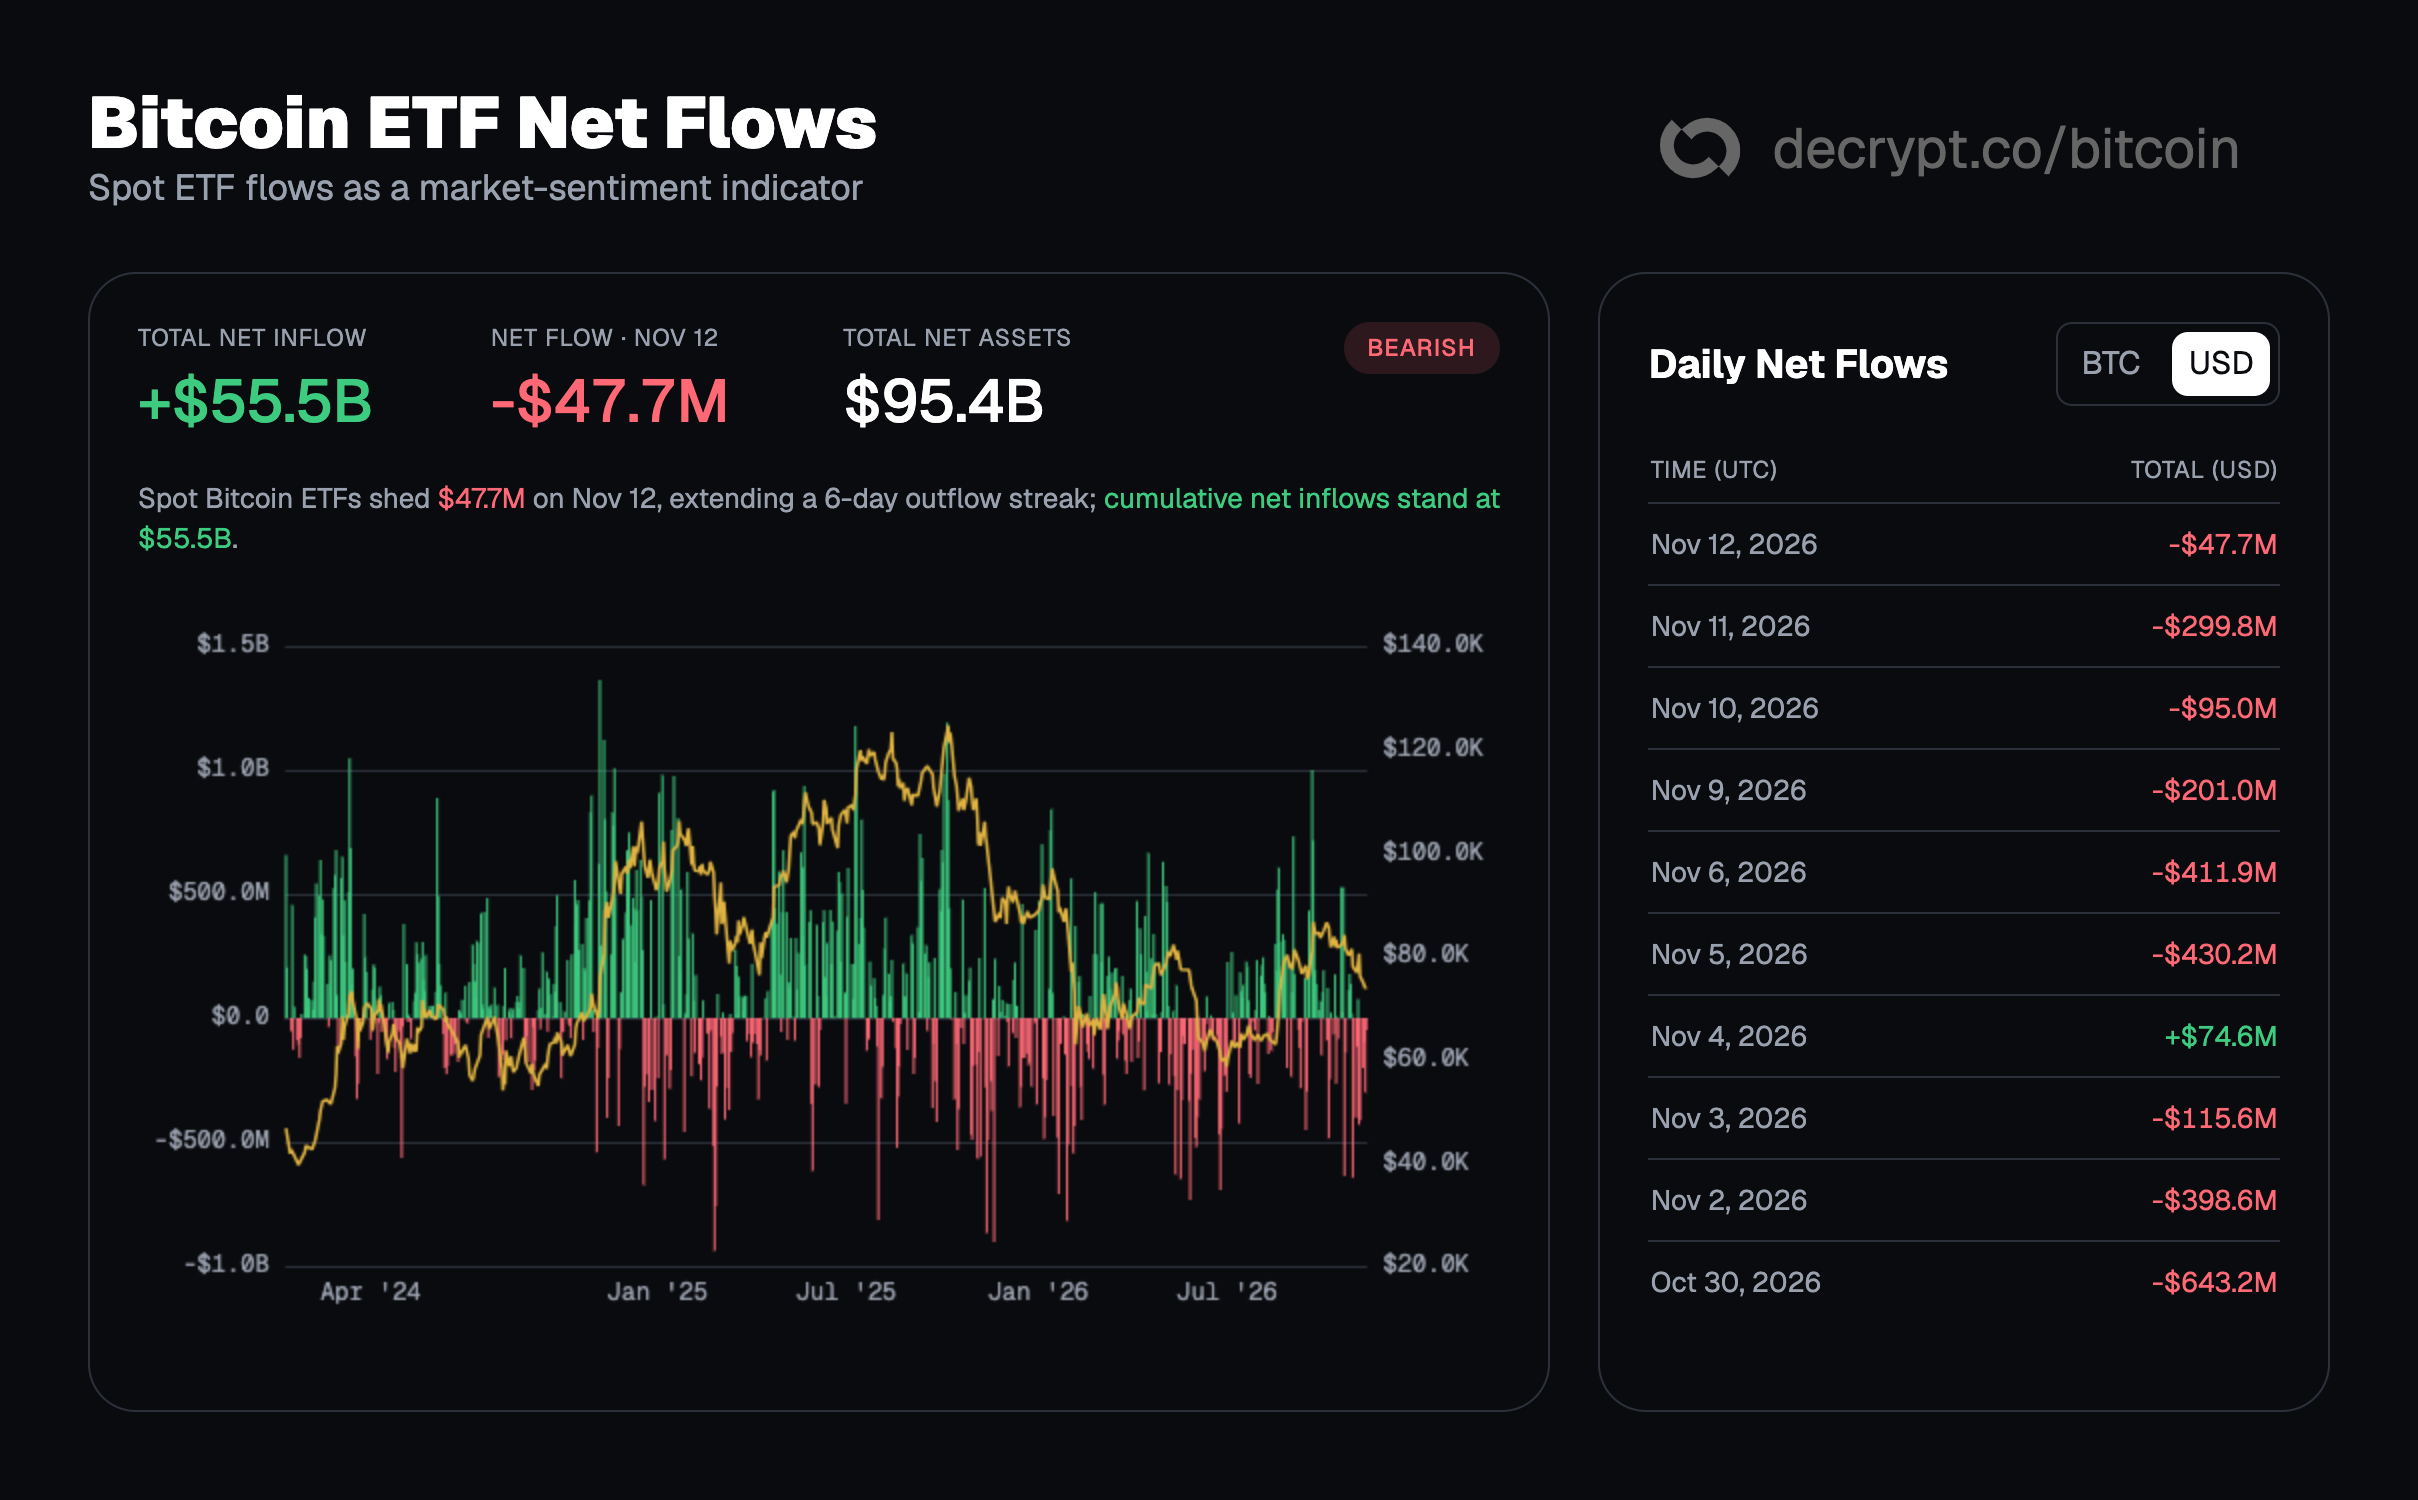
U.S. spot Bitcoin ETFs recorded approximately $1.49 billion in net outflows across six consecutive sessions from November 5 through November 12, including $47.7 million on Thursday. The funds nevertheless retained approximately $55.5 billion in cumulative net inflows. The original report noted that weaker ETF demand and forced liquidations of leveraged positions can accelerate a decline when buyers are scarce; the outflows alone do not establish that institutional investors have abandoned Bitcoin.
The report described a short-term pattern of lower highs and lower lows. Its cited daily-chart readings put Bitcoin’s relative strength index at 25.4—below the 30 level generally considered oversold—and its average directional index at 25.3, indicating an established trend. The 50-day exponential moving average remained above the 200-day average, although BTC had fallen below the shorter-term average.
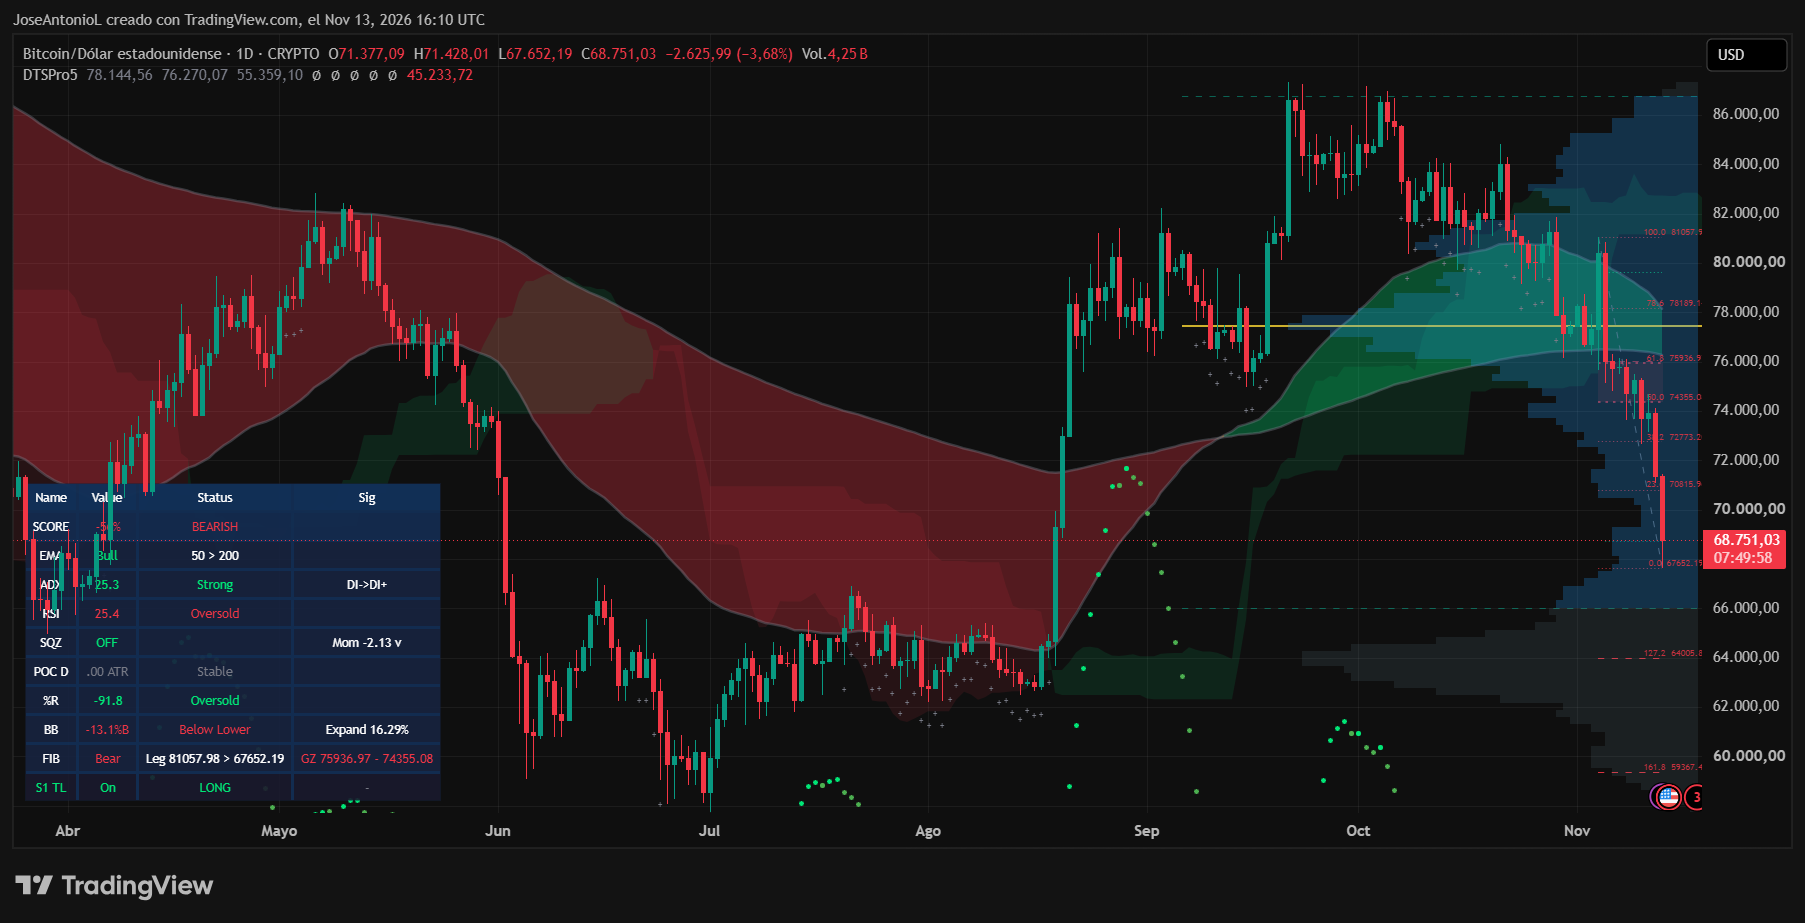
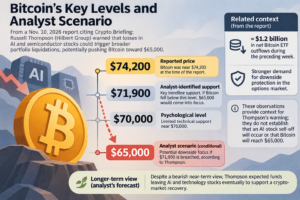
The report identified Friday’s intraday low around $67,650 as immediate support, with a further area near $64,000 if that level failed. It placed potential upside hurdles at $70,815 and $72,775, followed by a $74,355–$75,937 resistance zone. Its assessment left room for a temporary bounce but said the evidence was insufficient to declare a bottom. At the time of reporting, the next cited macro checkpoints were the Fed’s November 18 meeting minutes and the November 25 PCE inflation report.
Source: decrypt.co (originally published 2026-11-14 01:22 UTC+8)